- Design of five types of seismic force-resisting systems (SFRS) includes Special Moment Frame (SMF), Intermediate Moment Frame (IMF), Ordinary Moment Frame (OMF), Ordinary Concentrically Braced Frame (OCBF), and Special Concentrically Braced Frame (SCBF)
- Ductility check of the width-to thickness ratios for webs and flanges
- Calculation of the required strength and stiffness for stability bracing of beams
- Calculation of the maximum spacing for stability bracing of beams
- Calculation of the required strength at hinge locations for stability bracing of beams
- Calculation of the column required strength with the option to neglect all bending moments, shear, and torsion for overstrength limit state
- Design check of column and brace slenderness ratios
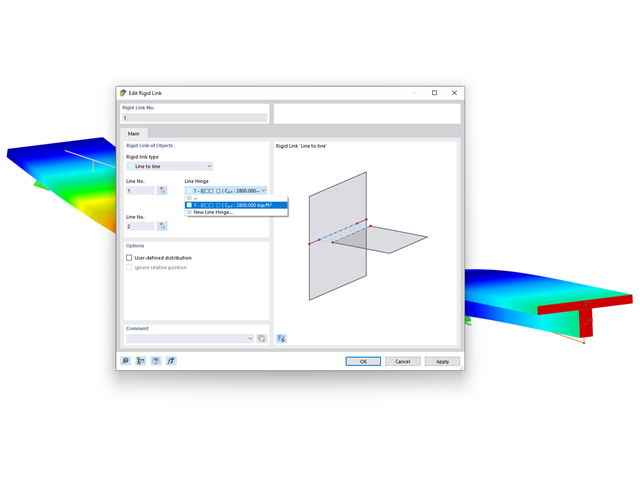
For rigid links, it is possible to define line hinges. This allows for semi-rigid coupling of different elements, for example.
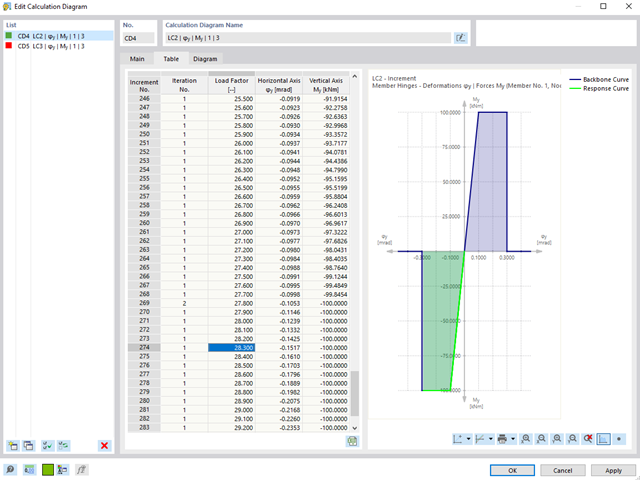
For calculation diagrams, the "2D | Hinge" is available. These hinge diagrams show the hinge response of load situations for nonlinear hinges.
For calculations with several load situations, such as is the case with pushover analyzes and time history analysis, you can evaluate the state of the hinge in each load step.
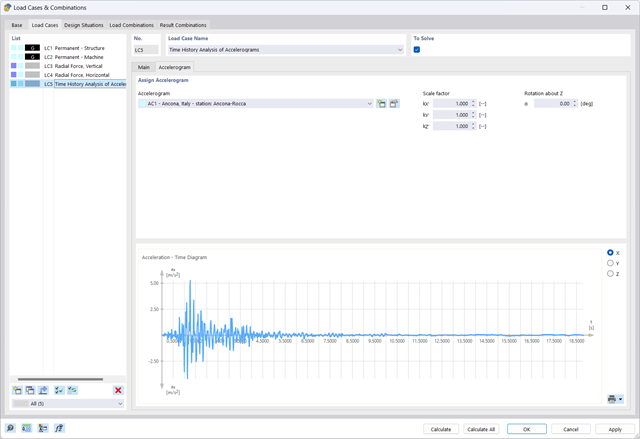
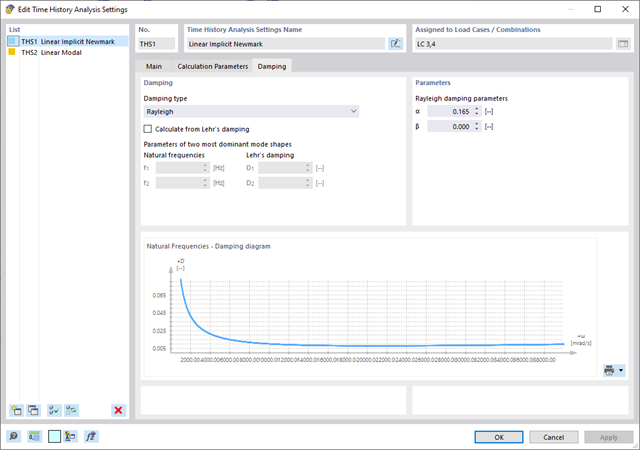
The Time History Analysis add-on provides you with accelerograms for the calculation. This extension allows for dynamic structural analysis of the acceleration-time diagrams.
There is an extensive library of earthquake records available for you, but you can also enter or import your own diagrams. The time history analysis is performed using the modal analysis or the linear implicit Newmark analysis.
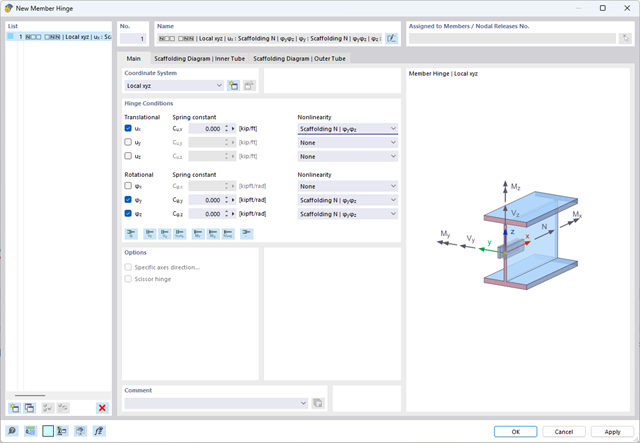
The member hinge nonlinearity "Scaffolding N | phiy,phiz" allows you to simulate an inserted scaffolding tube joint.
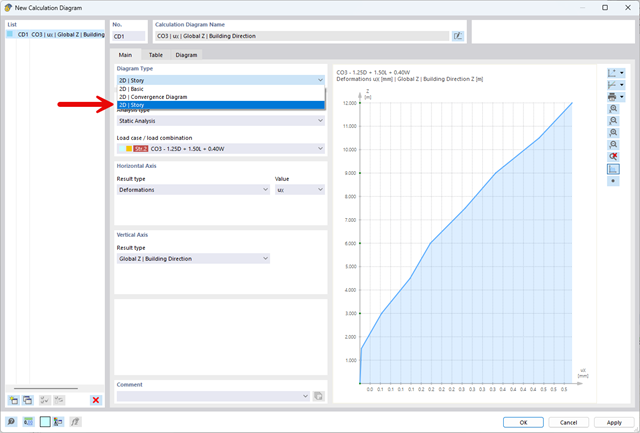
The "2D | Story" calculation diagram type is used to create result diagrams via the building axis. This allows you to easily analyze the behavior of the entire building under static and dynamic effects.
You can use this diagram type, for example, to visualize the seismic force over the building height.
- Analysis of time diagrams and accelerograms (acceleration-time diagrams exciting the supports of a structure)
- Combination of user-defined time diagrams with nodal, member, and surface loads, as well as free and generated loads
- Combination of several independent excitation functions
- Linear implicit Newmark analysis or modal analysis in time history
- Structural damping using Raleigh damping coefficients or Lehr's damping value
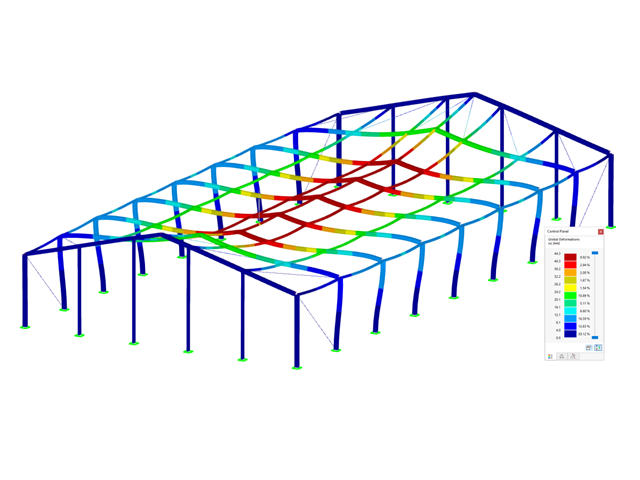
- Graphical display of results in calculation diagrams
- Result display in individual time steps or as an envelope during the entire time period
- Extensive library of seismic events (accelerograms)
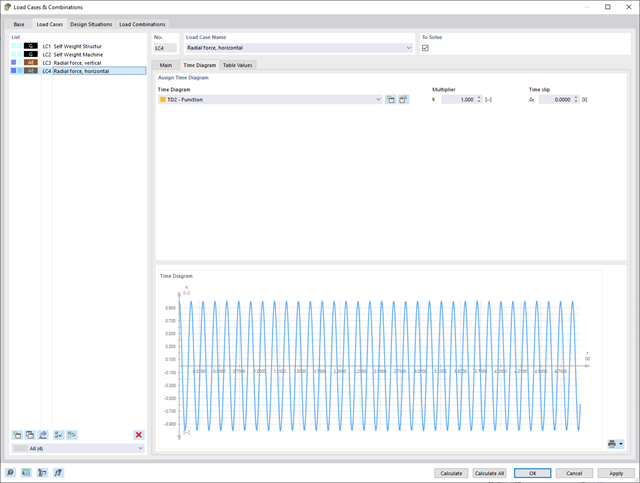
It is necessary to enter the required force-time diagrams. They can be combined in load cases or load combinations of the type Time History Analysis | Time Diagrams with the loading in order to define where and in which direction the force-time diagrams act.
The second option is to enter acceleration-time diagrams, which can be used in the load cases of the Time History Analysis | Accelerogram type.
All calculation parameters are specified in the time history analysis settings. These include, for example, the type of analysis method and the maximum calculation time.
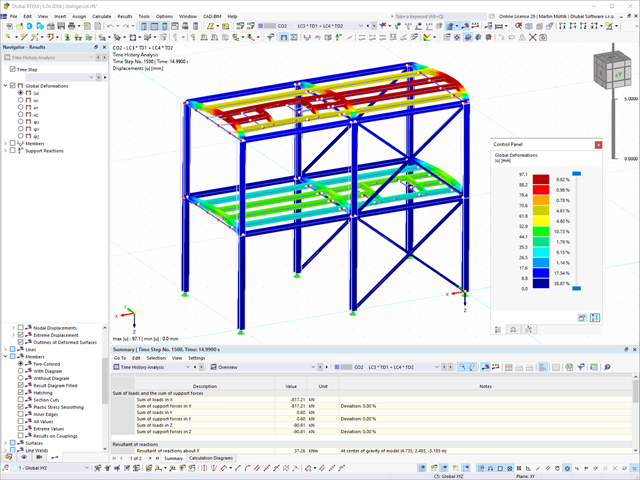
As soon as the program has completed the calculation, the summary of the results is listed. All result windows are integrated in the main program RFEM/RSTAB. You will find all the results arranged in tables; they can be displayed for each individual time step or as an envelope, and you also have the option of displaying the results graphically as well as animating them.
The results from the time history analysis can be displayed in the calculation diagrams. All the results are shown as a function of time. You can export the numeric values to MS Excel.
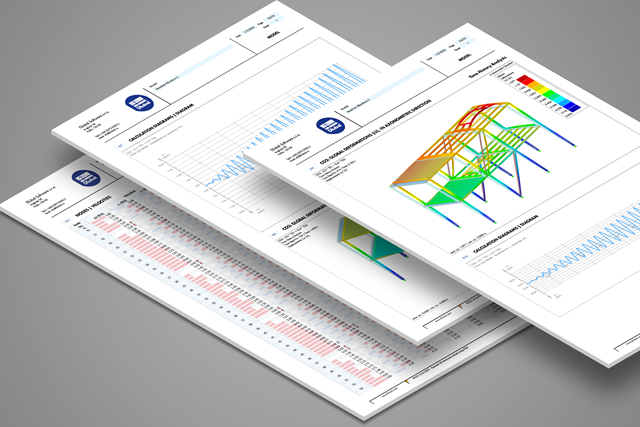
All result tables and graphics are part of the RFEM/RSTAB printout report. In this way, you can ensure clearly arranged documentation. You can also export the tables to MS Excel.
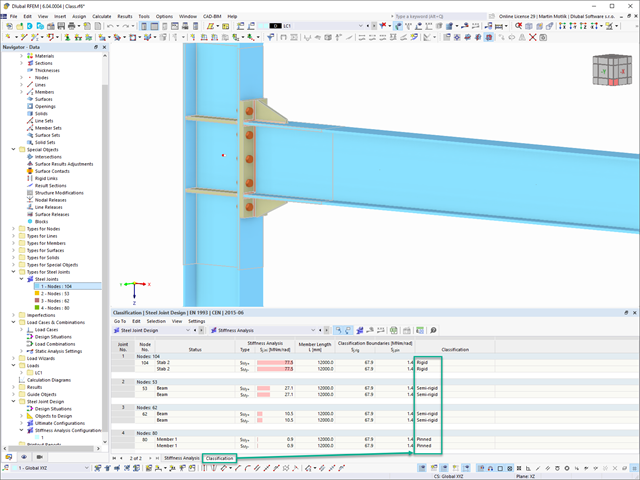
In the Steel Joints add-on, you can classify the joint stiffness.
In addition to the initial stiffness, the table also shows the limit values for hinged and rigid connections for the selected internal forces N, My, and/or Mz. The resulting classification is then displayed in tables as "hinged", "semi-rigid", or "rigid".
Go to Explanatory Video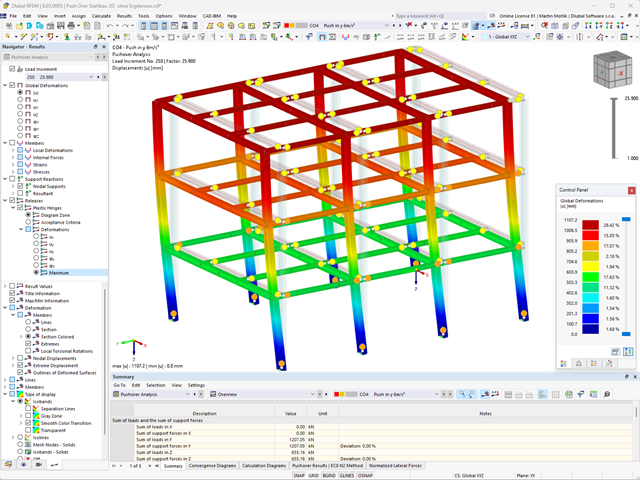
- Consideration of nonlinear component behavior using plastic standard hinges for steel (FEMA 356, EN 1998‑3) and nonlinear material behavior (masonry, steel - bilinear, user-defined working curves)
- Direct import of masses from load cases or combinations for the application of constant vertical loads
- User-defined specifications for the consideration of horizontal loads (standardized to a mode shape or uniformly distributed over the height of the masses)
- Determination of a pushover curve with selectable limit criterion of the calculation (a collapse or limit deformation)
- Transformation of the pushover curve into the capacity spectrum (ADRS format, single degree of freedom system)
- Bilinearization of the capacity spectrum according to EN 1998‑1:2010 + A1:2013
- Transformation of the applied response spectrum into the required spectrum (ADRS format)
- Determination of target displacement according to EC 8 (the N2 method according to Fajfar 2000)
- Graphical comparison of the capacity and required spectrum
- Graphical evaluation of the acceptance criteria of predefined plastic hinges
- Result display of the values used in the iterative calculation of the target displacement
- Access to all results of the structural analysis in the individual load levels
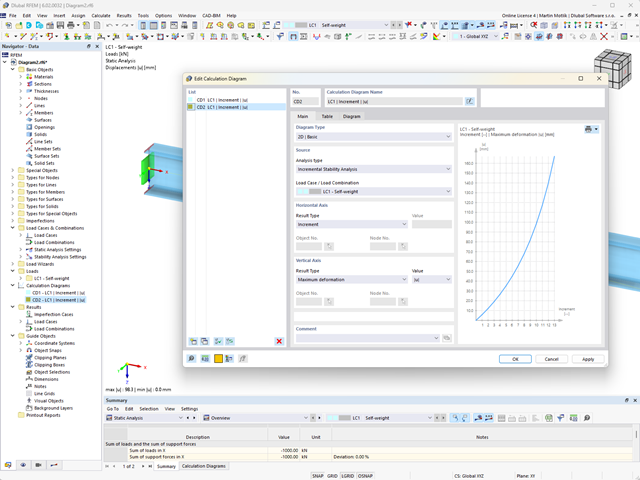
Do you want to create calculation diagrams? With RFEM and RSTAB, this works globally and without any problems. Create and organize your calculation diagrams directly in the Navigator - Data or via the menu Insert → Calculation Diagrams.
Use calculation diagrams to record and display a relation between the various calculation results.
It is also possible to superimpose similar diagrams.
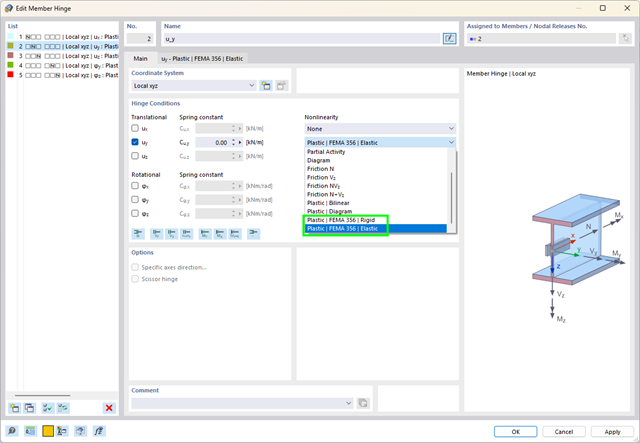
What are plastic hinges? Very simple – plastic hinges according to FEMA 356 help you to create pushover curves. These are nonlinear hinges with preset yield properties and acceptance criteria for steel members (Chapter 5 of FEMA 356).
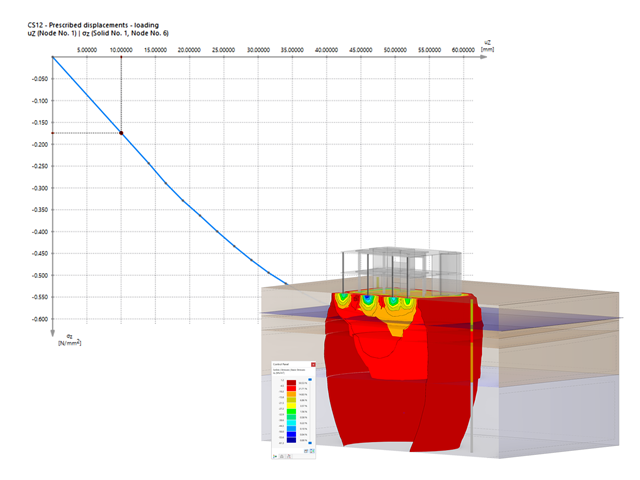
Are you ready for the evaluation? Use the calculation diagrams, which show the distribution of a specific result during the calculation.
You can freely define the layout of the vertical and horizontal axes of the calculation diagram. This allows you, for example, to consider the settlement distribution of a certain node, depending on the load.
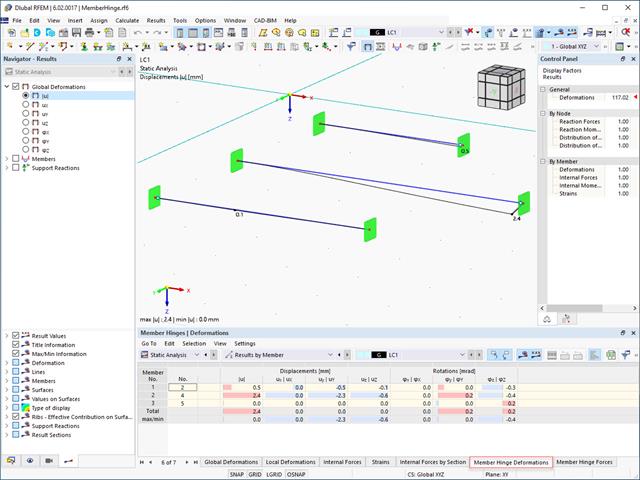
The results for members can be displayed graphically, using the Member Hinges navigator category. The numerical results of member hinges can be found in the Results by Member table category. The Member Hinge Deformations and Member Hinge Forces tables are available for the analysis and documentation of the deformation and force results in the area of member hinges.
The table lists the deformations and forces of each member for the locations specified in the Results Table Manager. There, you can also control which extreme values are displayed.
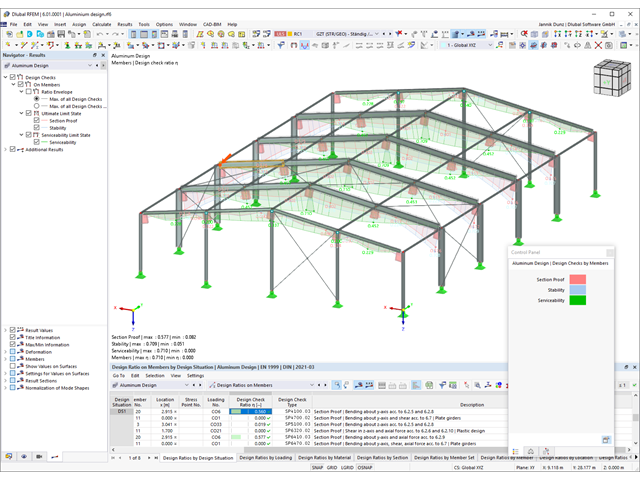
You can find the serviceability limit state design checks in the result tables of the Aluminum Design add-on. They are already fully integrated there. You have the option to display the design results with all the details at each location of the designed members. You can also use graphics with the result diagrams of the design ratios.
You can integrate all result tables and graphics into the global printout report of RFEM/RSTAB as a part of the aluminum design results. RFEM/RSTAB also allows you to display and document the deformations of the entire structure independently of the add-on.
Was your design successful? Very good, now comes the relaxed part. Because the program gives you the performed design checks in a table. You can display all result details in detail here. The clearly presented design formulas ensure that you will be able to understand the results without any problems. There is no black-box effect with Dlubal Software.
The design checks are carried out at all governing locations of the members and displayed graphically as a result diagram. You can find more detailed graphics in the result output. This includes the stress distribution on the cross-section or the governing mode shape, for example.
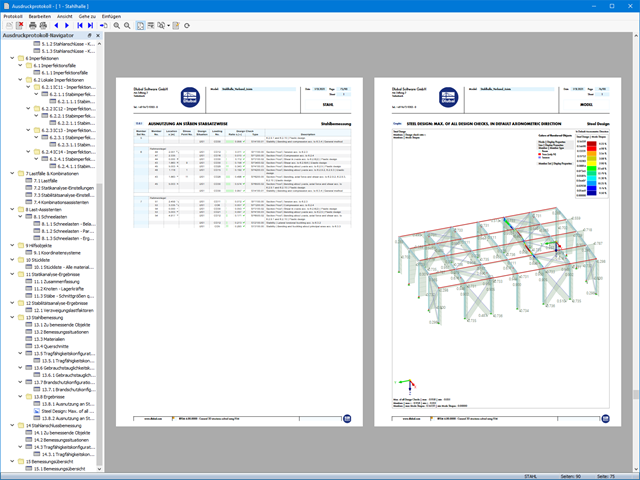
All input and result data are part of the RFEM/RSTAB printout report. You can select the report contents and extent specifically for the individual design checks.
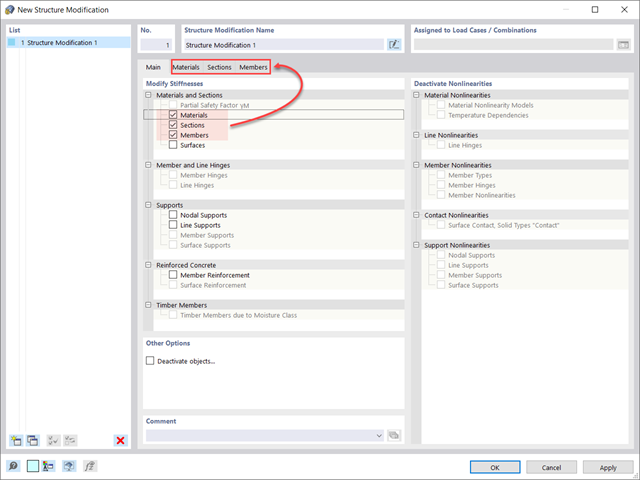
Did you know? You can easily define structural modifications in load cases of the Modal Analysis type. This allows you, for example, to individually adjust the stiffnesses of materials, cross-sections, members, surfaces, hinges, and supports. You can also modify stiffnesses for some design add-ons. Once you select the objects, their stiffness properties are adapted to the object type. In this way, you can define them in separate tabs.
Do you want to analyze the failure of an object (for example, a column) in the modal analysis? This is also possible without any problems. Simply switch to the Structure Modification window and deactivate the relevant objects.
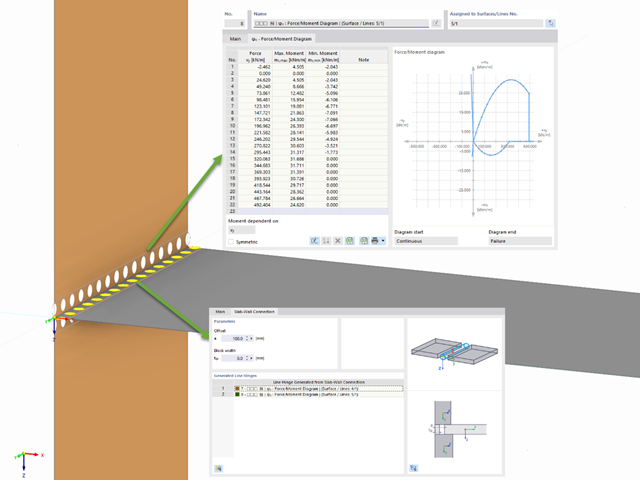
RFEM allows you to use a special line hinge to model the special properties of the connection between the reinforced concrete slab and masonry wall. This limits the transferable forces of the connection depending on the specified geometry. You guess right: This means that the material cannot be overloaded.
The program develops interaction diagrams that are applied automatically. They represent the various geometric situations and you can use them to determine the correct stiffness.
If your design is successful, the relaxed part of your work follows. Because the program does many processes for you. For example, the performed design checks are displayed in a table. It shows you all the result details. Due to the clearly presented design formulas, you will be able to understand the results without any problems. There is no "black box" effect here.
The design checks are carried out at all governing locations of the members and displayed graphically as a result diagram. Furthermore, detailed graphics, such as the stress distribution on a cross-section or the governing mode shape, are available for you in the result output.
All input and result data are part of the RFEM/RSTAB printout report. You can select the report contents and extent specifically for the individual design checks.
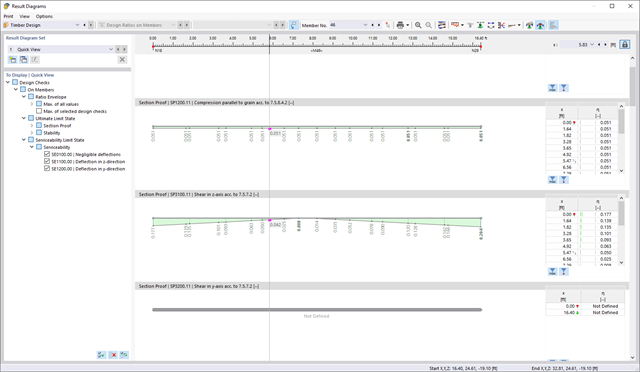
You find the serviceability limit state design fully integrated in the result tables of the Timber Design add-on. If yuo want to check the design results, you can open the program and display the results with all the details at each location of the designed members. Furthermore, graphics are available for you with the result diagrams of the design ratios.
A special thing is that All result tables and graphics can be integrated into the global printout report of RFEM/RSTAB as a part of the timber design results. You can also display and document the deformations of the entire structure as a part of the RFEM/RSTAB functionality. This function is independent of the add-on.
You can find the serviceability limit state design checks in the result tables of the Steel Design add-on. You can display the design results with all the details at each location of the designed members. Furthermore, graphics are available for you with the result diagrams of the design ratios. This gives you a good overview.
You can also integrate all result tables and graphics into the global printout report of RFEM/RSTAB as a part of the steel design results. Thus, you can display and document the deformations of the entire structure as a part of the RFEM/RSTAB functionality independent of the add-on.
- Manual specification of critical component temperature or automatic determination of component temperature for desired duration
- A wide range of fire curves: standard temperature-time curve, external fire curve, hydrocarbon curve
- Manual adjustment of the essential coefficients for the determination of the steel temperature
- Consideration of hot-dip galvanizing of structural components for the determination of the steel temperature
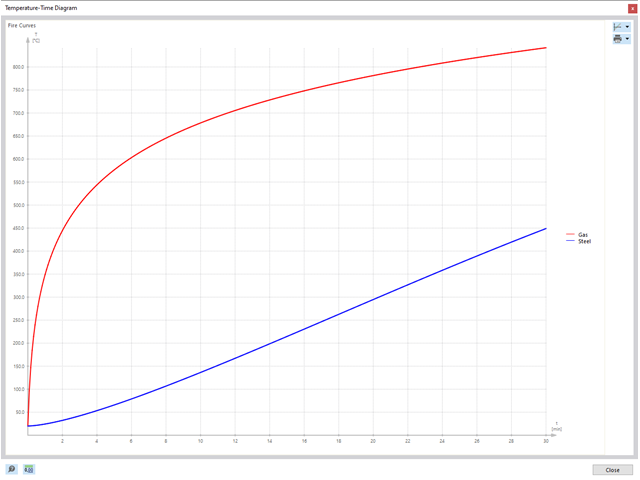
- Results of a temperature-time diagram for the gas and steel temperature
- Fire protection cladding as a contour or a box cladding with temperature-independent materials can be considered when determining the temperature
- Design of members made of carbon steel or stainless steel
- Cross-section design checks and stability analyses (equivalent member method) according to EN 1993‑1‑2, Clause 4.2.3
- Design checks of the cross-sections of Class 4 according to EN 1993‑1‑2, Annex E.
After completing the design, the Dlubal Software presents the fire resistance design checks clearly and with all result details. This makes the results comprehensible in detail. Furthermore, the results also contain all the parameters required for the determination of the component temperature at the design time.
You can also specifically evaluate the temperature distribution in the structural component using the temperature-time diagram.
All result tables and graphics, including the ultimate and serviceability limit state results, can be integrated into the global printout report of RFEM/RSTAB as a part of the steel design results.
The governing component temperature at the time of analysis can be determined for the fire resistance design automatically using the input. In this case, you can follow the temperature curve in detail as a function of timeby displaying the temperature-time diagram.

Did you know? In contrast to other material models, the stress-strain diagram for this material model is not antimetric to the origin. You can use this material model to simulate the behavior of steel fiber-reinforced concrete, for example. Find detailed information about modeling steel fiber-reinforced concrete in the technical article about Determining the material properties of steel-fiber-reinforced concrete.
In this material model, the isotropic stiffness is reduced with a scalar damage parameter. This damage parameter is determined from the stress curve defined in the Diagram. The direction of the principal stresses is not taken into account. Rather, the damage occurs in the direction of the equivalent strain, which also covers the third direction perpendicular to the plane. The tension and compression area of the stress tensor is treated separately. In this case, different damage parameters apply.
The "Reference element size" controls how the strain in the crack area is scaled to the length of the element. With the default value zero, no scaling is performed. Thus, the material behavior of the steel fiber concrete is modeled realistically.
Find more information about the theoretical background of the "Isotropic Damage" material model in the technical article describing the Nonlinear Material Model Damage.

Reinforced concrete usually answers the question "How much can you carry?" simply with "Yes". Nevertheless, you need a three-dimensional moment-moment-axial force interaction diagram for the graphical output of the ultimate limit state of reinforced concrete cross-sections. The Dlubal structural analysis software offers you just that.
With the additional display of the load action, you can easily recognize or visualize whether the limit resistance of a reinforced concrete cross-section is exceeded. Since you can control the diagram properties, you can customize the appearance of the My-Mz-N diagram to suit your needs.

Did you know that you can also display the moment-axial force interaction diagrams (M‑N diagrams) graphically? This allows you to display the cross-section resistance in the case of an interaction of a bending moment and an axial force. In addition to the interaction diagrams related to the cross-section axes (My‑N diagram and Mz‑N diagram), you can also generate an individual moment vector to create an Mres‑N interaction diagram. You can display the section plane of the M‑N diagrams in the 3D interaction diagram. The program displays the corresponding value pairs of the ultimate limit state in a table. The table is dynamically linked to the diagram so that the selected limit point is also displayed in the diagram.

Do you want to determine the biaxial bending resistance of a reinforced concrete cross-section? For this, you have to activate a moment-moment interaction diagram (My-Mz diagram) first. This My-Mz diagram represents a horizontal section through the three-dimensional diagram for the specified axial force N. Due to the coupling to the 3D interaction diagram, you can also visualize the section plane there.
.png?mw=640&hash=5a991f211d984ac624978f514e70c53da263e5d9)
Depending on the axial force N, you can generate a moment curvature line for any moment vector. The program also shows you the value pairs of the displayed diagram in a table. Furthermore, you can activate the secant stiffness and tangent stiffness of the reinforced concrete cross-section, belonging to the moment curvature diagram, as an additional diagram.